Residual Supply Mix for electricity certification
At BraveTrace, we strive to increase public understanding of the attributes and characteristics of energy purchased and consumed in New Zealand.
To this end, we ensure that energy purchases tracked through our system (the New Zealand Energy Certificate System or NZECS) are not also claimed by non-participating energy users. The mechanism by which we do this is called the Residual Supply Mix (RSM).
The RSM describes the nature of the electricity received by energy consumers who do not purchase New Zealand Energy Certificates (NZ-ECs) from BraveTrace Participants. It is a key part of how greenhouse gas (GHG) emissions are accounted for in New Zealand. BraveTrace seeks to include all contractual market-based instruments (forms of energy attribute transfer) into the RSM to ensure no double-counting occurs and so that non-certifying parties face more carbon intensive emissions factors.
Entities reporting the emissions intensity of consumed electricity may use either the RSM or the NZ-EC information provided by their supplier. Both approaches are market-based methods consistent with dual reporting requirements under the GHG Protocol.
The RSM and GHG Reporting
Reporting standards recognise two methods for calculating emissions from consumed electricity: location-based and market-based (known as dual reporting).
The Residual Supply Factor (RSF) and National Supply Factor (NSF) are both metrics used to calculate the greenhouse gas (GHG) emissions intensity of electricity consumption (typically in kg CO2-e/MWh), but they serve different reporting purposes under the GHG Protocol. The core difference is that the NSF represents the average intensity of the national grid, referred to as the National Supply Mix (NSM), while the RSF represents the remaining (more carbon-intensive) mix after the renewable generation volumes used in NZ-ECs are removed from the NSM.
Location-based method
This approach reflects the average emissions intensity of the grid (including both fossil fuel and renewable sources) where passive consumption occurs, typically using grid-average data. Sources for this information include:
- National Supply Factor (NSF): the emissions factor of the National Supply Mix (NSM) – the total mix of electricity generation supplying grid demand – published by BraveTrace.
- Grid-average emissions factors provided by the Ministry for the Environment (MfE) and the Ministry of Business, Innovation, & Employment (MBIE).
Market-based method
This approach reflects the emissions associated with the electricity that energy users have voluntarily chosen to support. Rather than applying the grid-average emissions intensity, it uses emissions factors linked to specific procurement choices. In other words, the market-based approach uses volumes and emissions factors minus the redeemed NZ-EC volume. Consumers that voluntarily purchase NZ-ECs can apply a zero-emission factor to the corresponding volume of electricity consumption. For any electricity consumption not covered by NZ-ECs, the applicable market-based factor is the more carbon-intensive RSF, based on the RSM published by BraveTrace.
The RSM is calculated by modeling electricity supply, adding up generation and emissions data for all generation facilities in New Zealand, and deducting for the volume of NZ-ECs redeemed within that period.
The RSF will always be higher than the NSF. The increasing difference between the two is driven by the increasing volume of NZ-ECs being purchased. Factors such as increased use of fossil fuels will affect the NSF, wherever it is published, and therefore also the RSF.
The calculation of the underlying NSM is performed by EnergyLink, who obtain their data from various sources. For this reason, these NSFs will vary slightly from numbers produced by MfE and MBIE, due to differences in underlying inputs and assumptions. A description of the methodology used by EnergyLink is here.
Final and Interim Residual Supply Mixes
The RSM is calculated each quarter, with a final RSM and subsequent interim RSM released. The two RSM values are to meet the needs of achieving flexibility, accuracy and timeliness. They are also designed to align with other relevant information, such as those numbers released by MBIE and MfE. In 2026, a shift in the way the RSM is presented occurred; please consult the relevant tables for your requirements. Details on the changes and how the quarters work in the NZECS are here.
- Download the latest RSM results here.
Version information is held within the spreadsheet. Previous versions can be requested from Bravetrace if required.
Final RSM
The final RSM for a quarter is published once the quarter has closed for trading and no further redemptions can occur. The difference of the RSM from the NSM continues to grow in line with growth in the number of NZ-ECs redeemed. Download our latest Annual Report that holds information on the final RSM here.
NZ-EC Volume Redeemed in the NZECS (MWh)
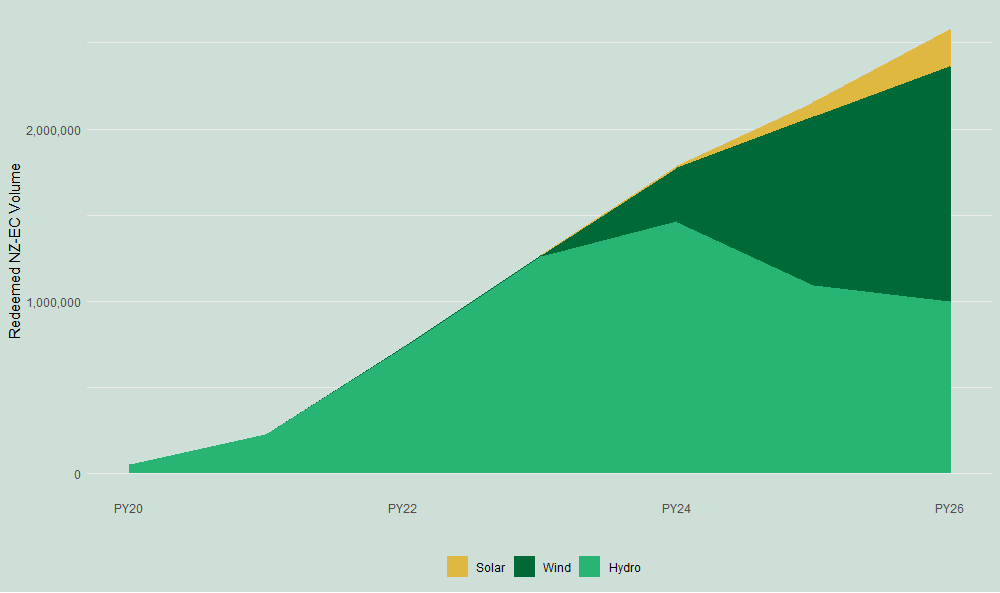
The graph above illustrates the growth of NZ-EC adoption over the years, alongside a recent increase in procurement from utility-scale wind and solar production devices.
Carbon intensity difference between the NSM and the RSM (kg CO2-e/MWh)
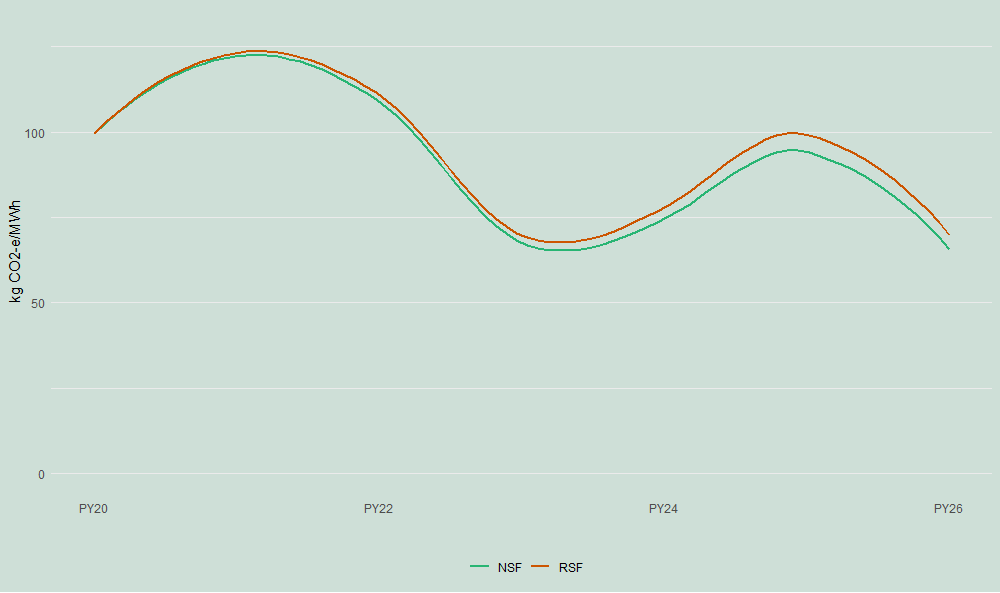
The graph above illustrates New Zealand’s strong dependence on seasonal hydrological patterns (dry years versus wet years), while highlighting the growing difference in carbon intensity between the NSF and the RSF.
Interim RSM
In addition to the final RSM, BraveTrace publishes an interim RSM to provide a preliminary market-based emissions factor prior to the official closing of NZECS redemption periods. The interim RSM is a provisional figure, as redemptions may still be recorded within the applicable compliance window. Accordingly, the calculation remains subject to adjustment until all relevant registry data are finalised and reconciled.
Consistent with prior reporting cycles, final RSM figures have tended to be modestly more carbon-intensive than the corresponding interim quarter figures, with variances typically in the range of +3-4%. This reflects the occurrence of redemptions after the interim cut-off date. In the NZECS, the majority of redemptions are undertaken on a monthly or quarterly basis, with over 90% of retirements occurring within three months of the relevant reporting period.
Interim RSF figures are suitable for indicative reporting and internal decision-making purposes. For greenhouse gas disclosures and formal compliance reporting, parties may choose to use interim RSF figures, or wait for final RSF figures to become available, or wash-up previously used interim RSF figures against final RSF figures once they are known.
RSM FAQs
- Why are there differences between NSM/NSF figures published by BraveTrace and MfE?
The difference between the BraveTrace NSM/NSF and that published by the Ministry for the Environment (MfE) will be due to differing inputs and assumptions. These include plant heat rates, fuel ratios for dual fuel plants, differing data sources and varied publishing periods. For these reasons, we would expect some minor variance between our published NSM/NSF figures and those published by MFE.
- What is the carbon accounting significance of the RSM?
According to the GHG Protocol Scope 2 Guidance (2015), “companies with any operations in markets providing product or supplier-specific data in the form of contractual instruments shall report scope 2 emissions in two ways and label each result according to the method: one based on the location-based method, and one based on the market-based method. This is also termed “dual reporting.” Dual reporting looks at what is going on at a country level (termed location-based) and what an organisation is doing voluntarily through contractual instruments such as NZ-ECs (market-based). In addition, the GHG Protocol Scope 2 Guidance has several quality criteria that are required to use any contractual instrument in the market-based method. One of these requires that “an adjusted, residual mix characterising the GHG intensity of unclaimed or publicly shared electricity shall be made available for consumer Scope 2 calculations, or its absence shall be disclosed by the reporting entity.” Both NZ-ECs and the RSM are compliant market-based reporting methods. While contractual instruments such as NZ-ECs reflect individual corporate choice for renewable energy procurement, the RSM reflects the overall market choice. The existence of an up-to-date RSM will improve the accuracy of the emissions allocation within the New Zealand market. The guidance also states that “companies shall use the most accurate and appropriate emission factors listed in the emission factor hierarchy for each method.”
- Are all energy attribute purchases recorded on the NZECS registry?
There are some PPAs and other forms of contractual market-based instruments that are currently not registered on the NZECS, and therefore cannot be accounted for within the RSM. This raises questions around double counting, and therefore ownership claims, of these renewable attributes as there has been no subsequent removal from the emissions factor claimed by others in their emissions inventories. The GHG Protocol Scope 2 Guidance requires the use of the RSM for market-based reporting. Additionally, the RE100 2025 Technical Criteria states the following: “A claim to use of renewable electricity must be unique and exclusive. Corporate buyers must be able to demonstrate that they have such claims. This means securing property rights to renewable electricity attributes. Energy attribute certificates are recommended as the best method for tracking and establishing ownership of energy attributes.” Further more, from 1 January 2027, RE100 requires its members that all renewable electricity purchased from the grid in markets where Energy Attribute Certificates are in common use must be tracked with energy certificates. In New Zealand, this means using the BraveTrace NZECS (see pages 15 and 32). RE100 confirms that renewable claims backed by NZ-ECs (New Zealand Energy Certificates) provide the highest level of credibility.
- What is not included in the RSM calculation?
- Residential roof-top solar
- Other contractual arrangements not tracked on the NZECS
- For more detail on what’s not included in the interim RSM, review the NZECS RSM methodology document here.
- Why would the interim RSM figures change?
On publication of each interim RSM, the previous interim RSM values get re-calculated and can sometimes change slightly, with variances typically in the range of +3-4%. To support transparency, BraveTrace tracks and discloses these variances in the quarterly published RSM reports). This reflects the occurrence of redemptions after the interim cut-off date. In the NZECS, the majority of redemptions are undertaken on a monthly or quarterly basis, with over 90% of retirements occurring within three months of the relevant reporting period. Currently, this is captured by maintaining a previous version of figures within the spreadsheet. The spreadsheet reflects the most recent and accurate values. BraveTrace tracks and publicly released Reasons for changing interim RSM values include:
- Addition of new generation
- Redemption of NZ-ECs for newly registered Energy Users
- Redemption of NZ-ECs for the actual consumption volume of an Energy User